Downtime Record System
Version 6
Background
There are two principal obstacles to properly record downtime and analyze its causes:
It is typically documented on paper after the event - so it is hardly accurate (surely missing frequent short stops)
The paper records have to be gathered and entered into an application (often Excel) to perform analysis - which is not only time-consuming but also difficult to share among departments and teams.
A usual example is that all too often the Maintenance and Production departments have different perceptions on what downtime really is.
Solution
DRS Software from Brain Software provides an accurate solution:
On-site event recording: It allows operators to enter downtime events directly into the system, when it occurs, recording downtime against each production unit (process, equipment, production order or just a Line name). To record downtime, the operators start an event and record the details as perceived in this stage from a pre-configured multi-level hierarchy of downtime classifications. A visual signal can be displayed requesting attention to this event. While time runs and the event is still active, emails are sent to the responsible(s) to fix the cause of downtime. As the event is attended, fixed and closed, the software registers response times and records them in a database to provide tools for further analysis.
Downtime events are ultimately classified into incidents like:
- Breakdowns, equipment failures,
- Technical reasons related to the equipment and process,
- Quality-related - when a line does not reach the acceptable production standard,
- Operational - when the procedures have not been followed properly,
- Unplanned stops - e.g. material shortages, man-power shortages,
- Planned stops - e.g. planned maintenance, changeovers, set-ups, etc.
Benefits
- Respond faster - with immediate availability of downtime information - even in very large industrial environments.
- Improved accuracy of downtime events - occurrences, durations, reasons; build a solid platform for decision making.
- History - develop a detailed history of downtime events for Continuous Improvement teams to work with.
- Visibility - dashboards provide everyone current information - live.
- Save time - with computerized data collection - reducing non-productive wasted time.
- Reduce conflict – all departments will share the same version of downtime records and same information on real time.
- Fast Communication - Send e-mails and SMS to every one that must know.
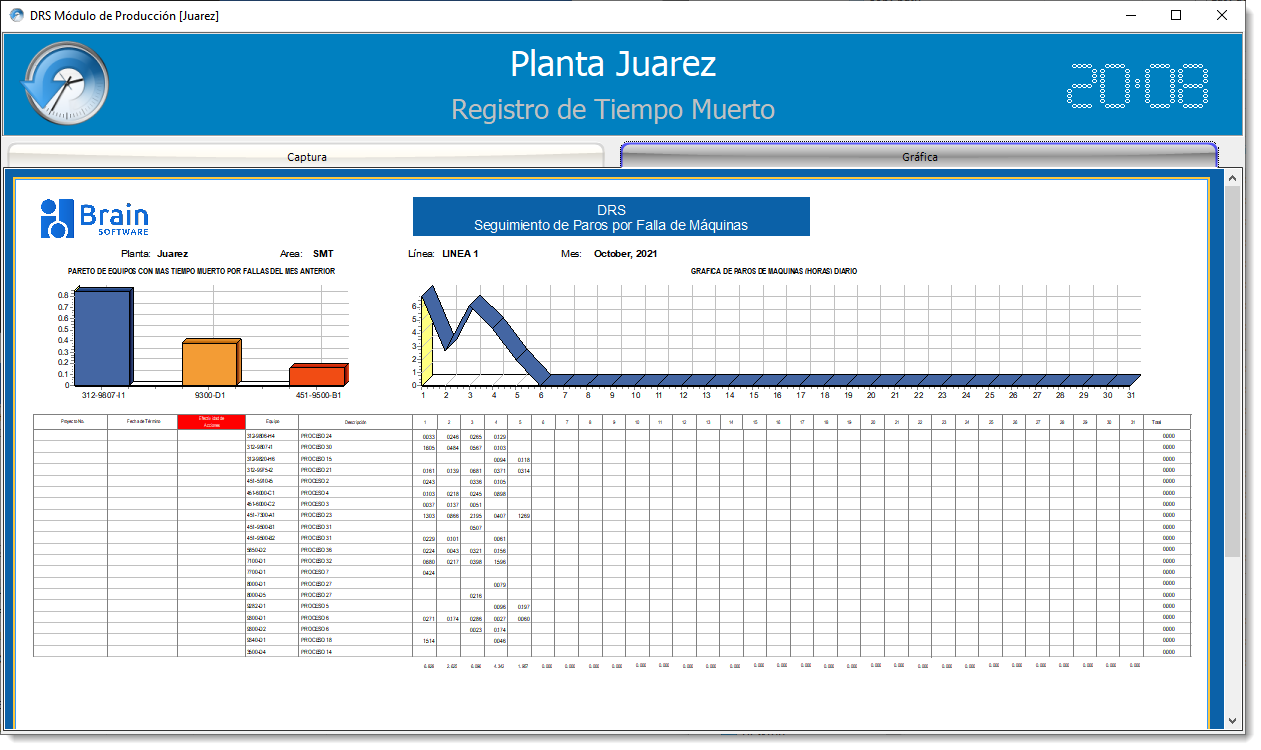
- Reports and Graphs - DTRS software data can be used to calculate relevant KPIs like MTBF, MTTR or MTTF
- Additionally, downtime can be displayed on dashboards and events can be exported to Excel to perform extra analysis
Modules
|
|
Administration Module This module contains all catalogs and tools to administer Brain's Downtime Register System. You will preview, print. export and design reports and graphs . |
|
|
Production Module This module registers the downtime events for one or several lines. Also shows the lights for the active events, the scalation level and lets users to create, attend and close events. |
|
|
Dashboard Module Use this module to display and monitor the events of a set of lines, configurable in the Administration Module. |
|
|
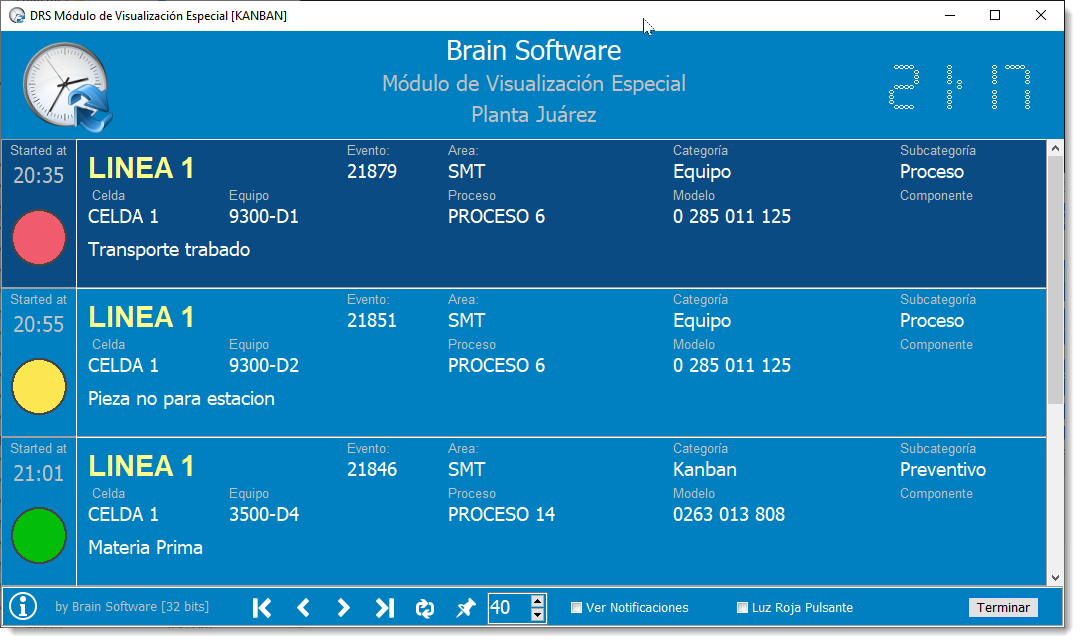
Especial Module This module is similar to the Dashboard Module, execept it shows events for lines and categories. You configure it in the Administracion Module. |
|
|
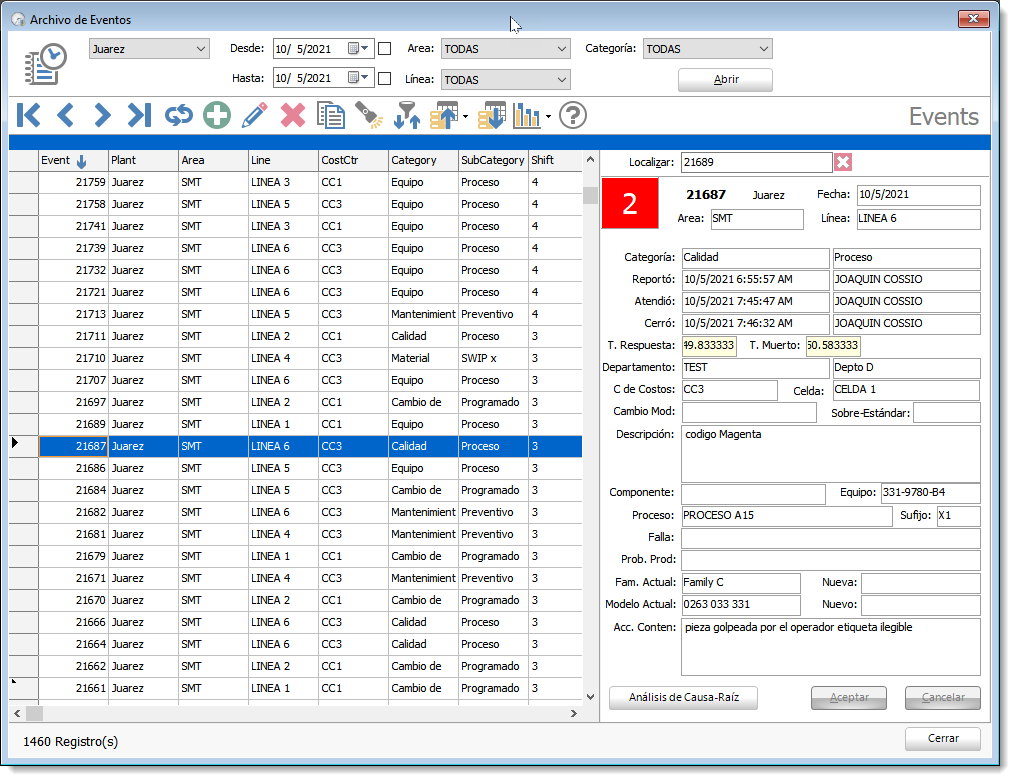
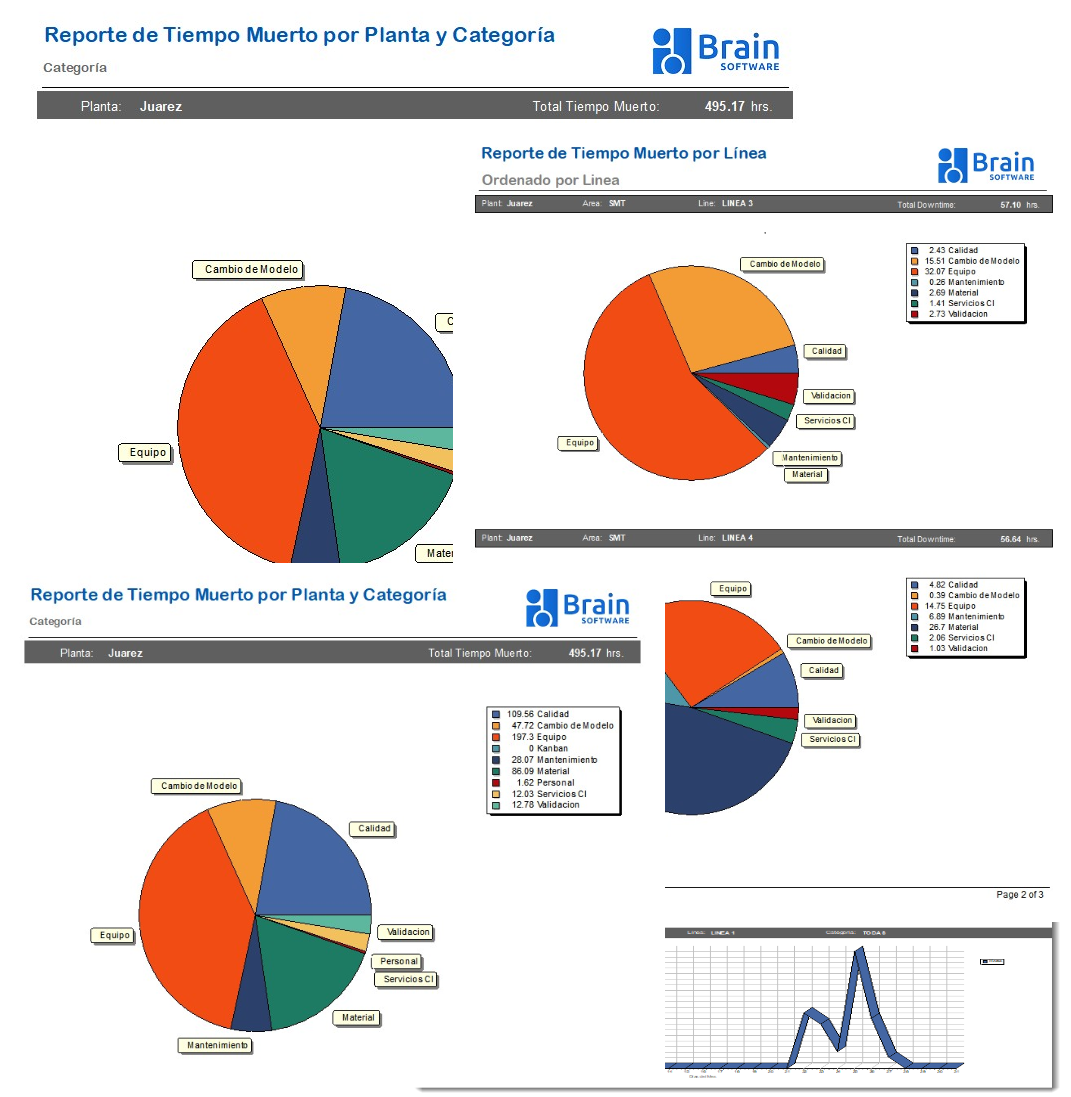
Reporter Module In this module, you can filter the events by date, production area, event categories and any other criterion you choose, display graphs or export the result to MS-Excel or design, print or export reports. |


New in Version 6
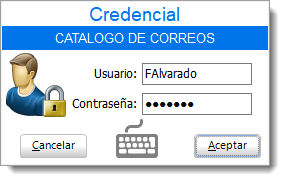
Administration Module
Log in once, No need to write you user name and password for each catalog you want to open.
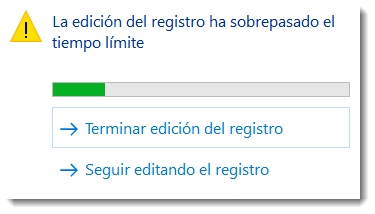
If you take a long time editing a record, the system advises you so, and if the station is unattended, ends the operation for you.
Updated reports in Reporter Module and in Administration Module. We included a Report Editor so you can modify the new reports.
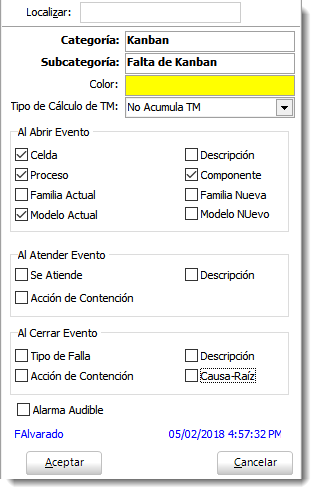
New Category/Subcategory to not accumulate downtime.
Useful when you need to call the attention to some event when the line is still operating, like prevent the shortage of material.
New especial dashboard to display lines/categories combinations
A perfect way to monitor the duration of special events like the ones that are related to shortage of material or changeover in critical lines.
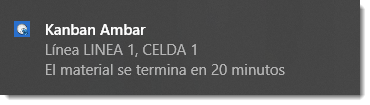
|
You can configure the time for the light to go red and put it on top of all windows. Even if it's minimized, this module can show native OS notifications for Windows 8 and 10 or a custom notification for Windows XP to 7. |
|
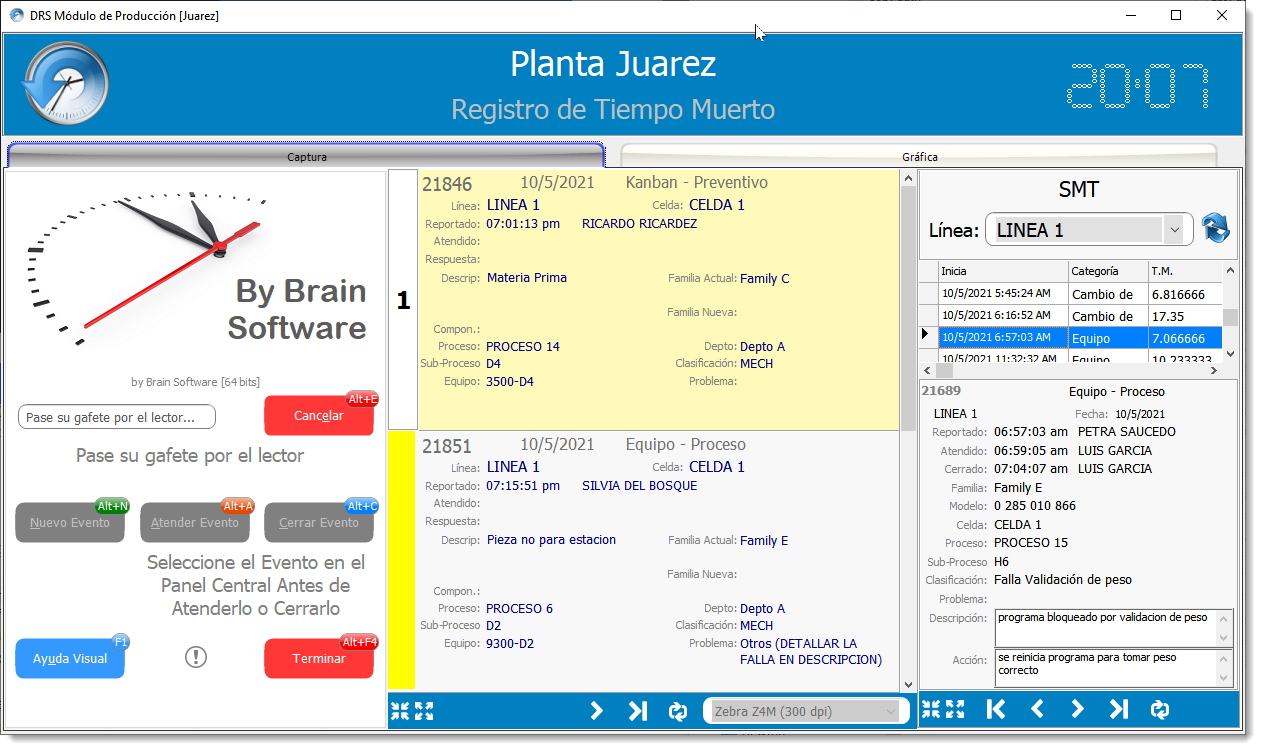
Production Module
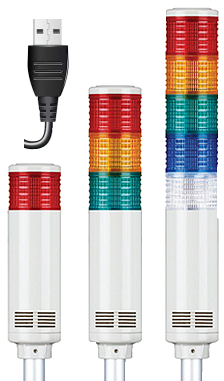
USB interface for signal tower lights for simplified installation.
The Brain DRS Production Module retains the old USB digital card interface for backward compatibility so you can upgrade to the new version 5 and keep your current hardware. When you are ready to upgrade to the new signal tower lights, you just change an entry in the configuration file and connect the lights to a USB port.
|
You can choose the combination of colors to use in your installation. |
You will only need one of this lights, they change of color accordingly to the events open. |
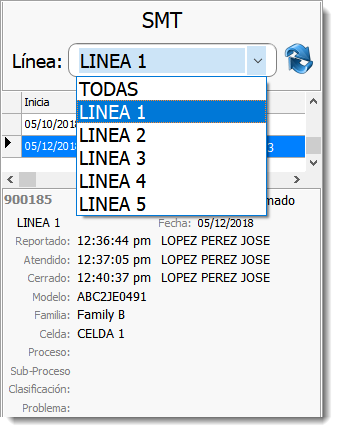
Multi-Line GUI
You can configure the Production lines to register the downtime of any line in the same area or all lines together. Select one line name or "TODAS" and the events for the shift will be displayed.
Also, the signal tower lights will reflect the selection you make.
This is useful when you setup a new line and need to start registering the downtime right away. You just use one of the already working production modules and you are all set.
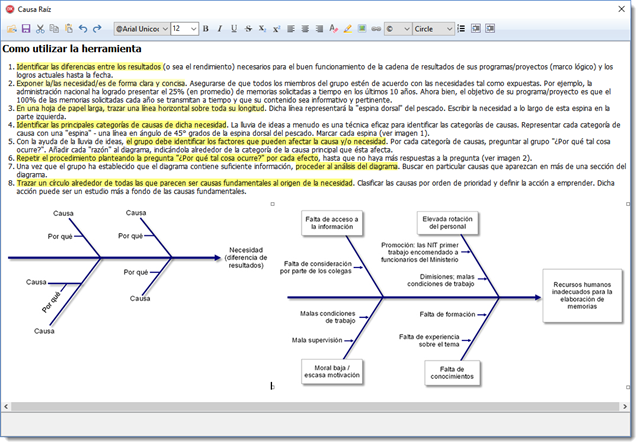
Root Cause Analysis
We added a new module to fill a template with information for Root Cause Analysis, AKA the Five Whys, to help identify the possible causal factor for the event you are closing. To avoid any delay closing the event, the template will be filled after the event is closed and will be available for further revision in the Administration Module. The template can be in any format installed in the local PC (doc, docx, xls, xlsx, etc) and a full feature rich text format editor is included so you can highlight words and insert pictures.
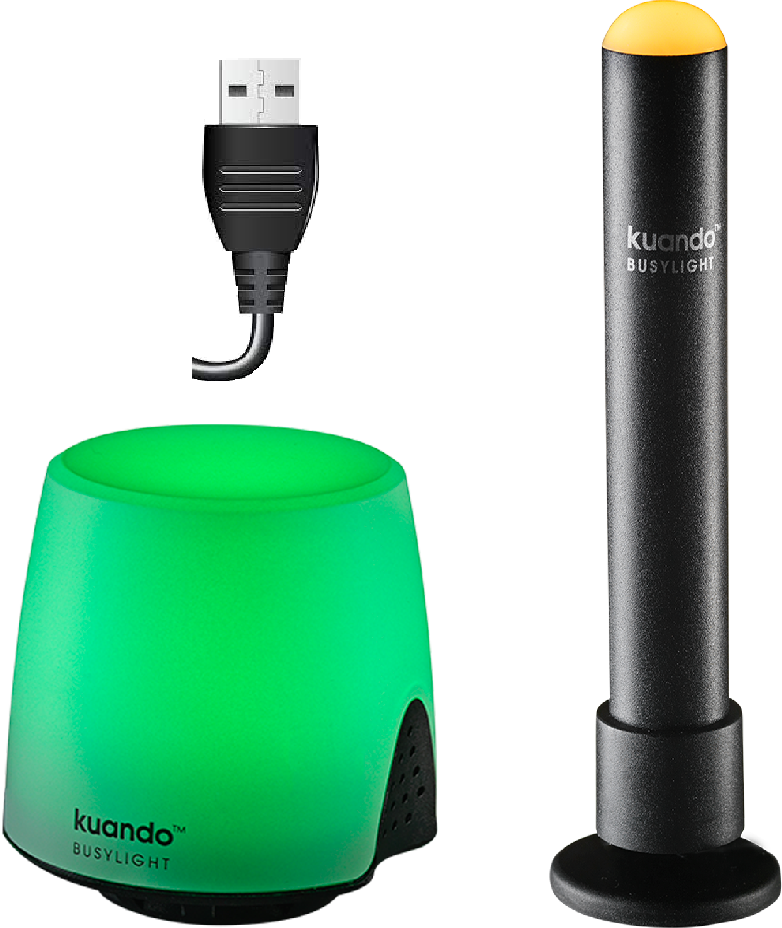
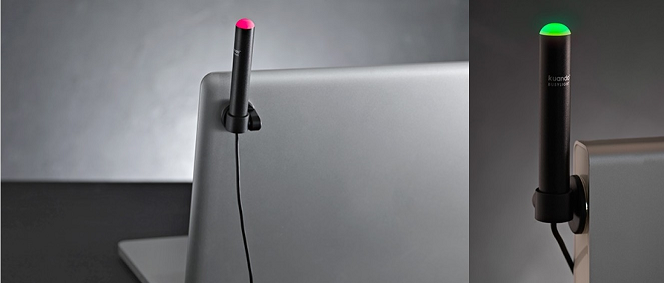
New ‘Mini Tower Light’ to Monitor Downtime Status in Critical Lines.
This tool will allow you to configure one or several lines to monitor
You can attach this mini tower to the screen of you desktop or laptop. Configure the DRS Module to monitor one or several lines.
As soon as the line registers a change in its events you will see the new status in your desktop or laptop.
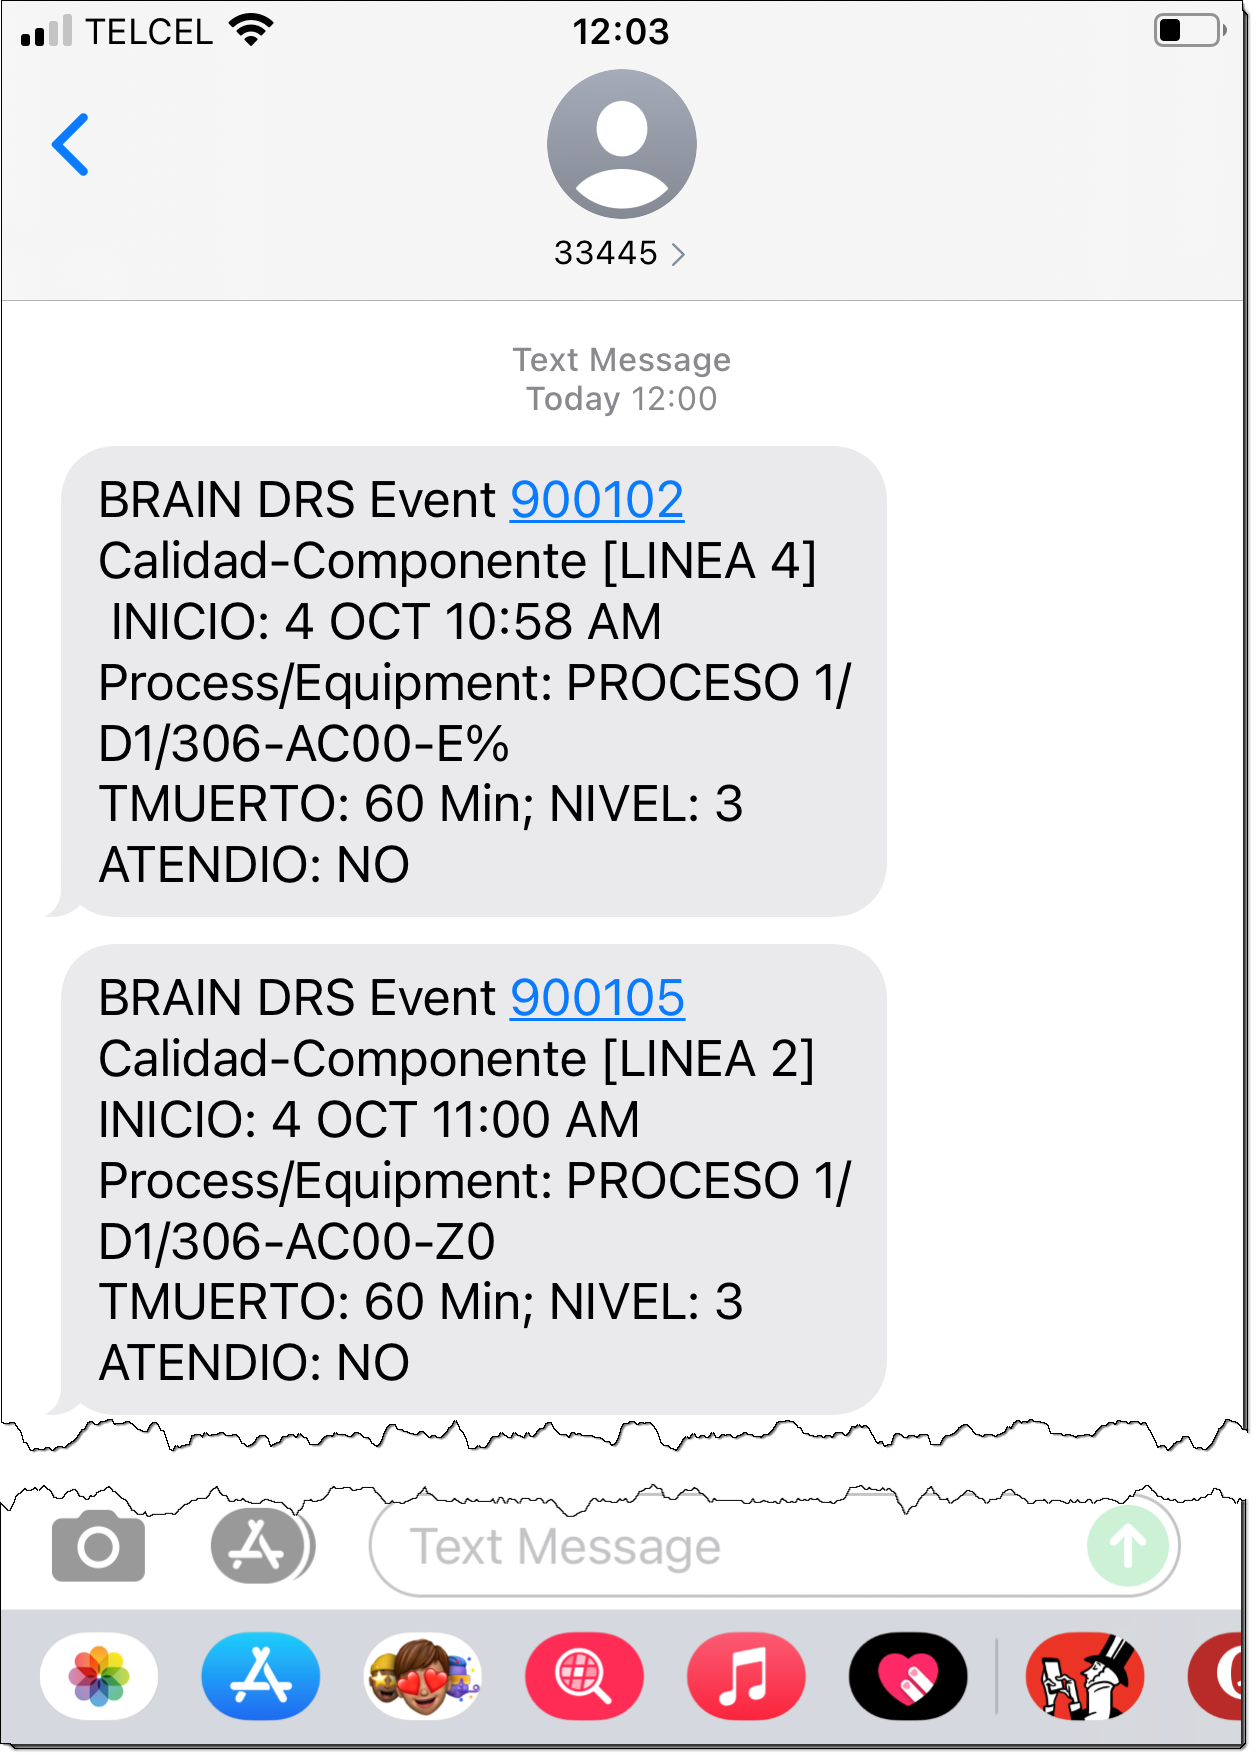
SMS text messages.
SMS sent to personnel working on the factory floor or outside their work place without access to e-mail.
This function requires a third party SMS provider.
Next Planned Updates
User interface upgraded
The user interface will be upgraded with a new look and new features will be added to make it more easy of use.
Events added from external sources.
Events can be started from a PLC or any external program using Inter-Process Communications (IPC), Transmission Control Protocol (TCP) or even a text file.
Automatic generation of weekly reports.
We are working in a windows service to generate several week reports in the background, without any user intervention.
You'll define a root folder and the service will add a folder with the week number and will save the reports in it.
We are considering the convenience to generate HTML or PDF as the format for the reports.
Web dashboard to display lines events.
A dashboard will be displayed in your favorite browser, platform agnostic, for you can display it without connecting to you database. This web dashboard will be running as a windows service, no need to set-up and configure an Internet Server.
Programmed events to be automatically added.
You will program events -equipment maintenance, personnel meetings, etc- and these events will show up at the proper time in the line.
... and more to come...
Runs on Windows 7, 8, 10 and 11. 32 and 64 bit versions are available.
The system uses MS-SQL Server, although it can be modified to use Oracle or almost any other relational database..
Custom modifications and source code are available. A modified Software as a Service (SaaS) model is available.
We only sell through our authorized distributors
Warranty, support and technical assistance requests can be attended by Brain Software
You can contact us at brain.info@brainsoftware.net