Version 7
Background
There are two principal obstacles to properly recording downtime and analyzing its causes:
It is typically documented on paper after the event, so it is rarely accurate and often misses frequent short stops.
These paper records must be gathered and entered into an application (often Excel) to perform analysis, which is not only time-consuming but also difficult to share among departments and teams.
A common example is that, all too often, Maintenance and Production departments have different perceptions of what downtime really is
Solution
Brain ANDON System from Brain Software provides an accurate solution:
On-site event recording
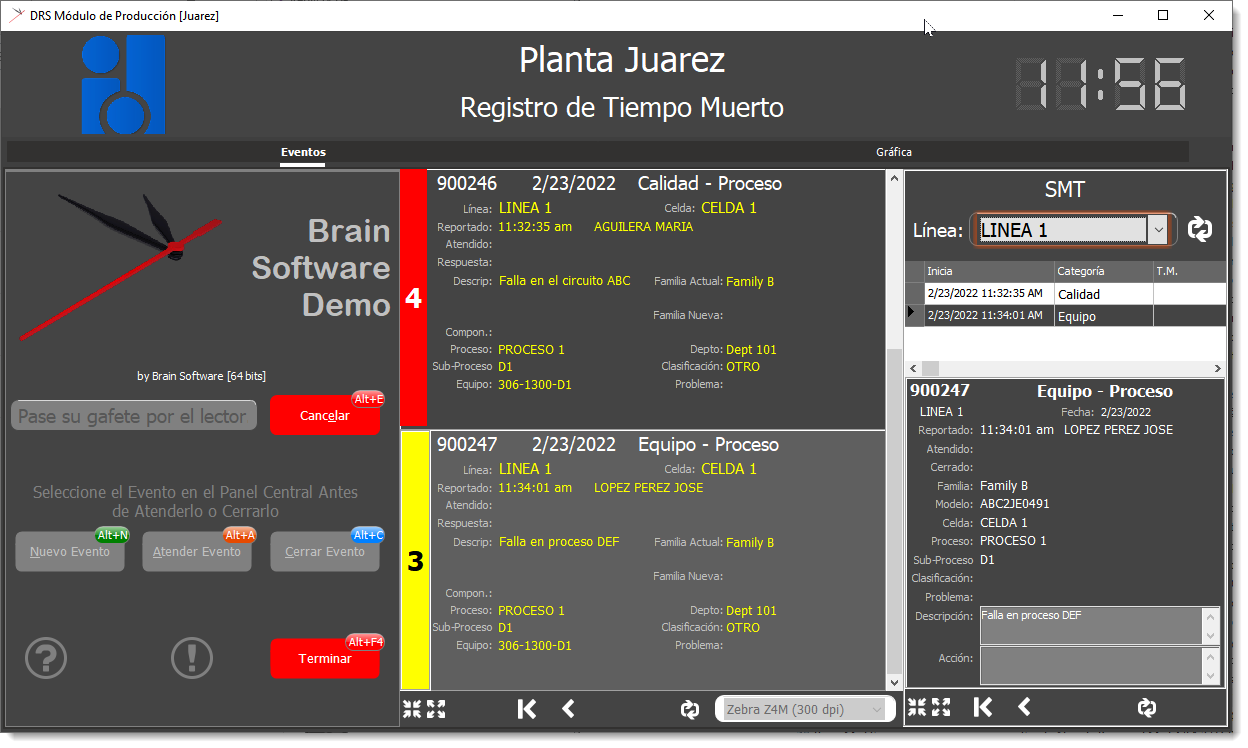
Operators can enter downtime events directly into the system as they occur, associating the downtime with specific production units (process, equipment, production order, or line name).
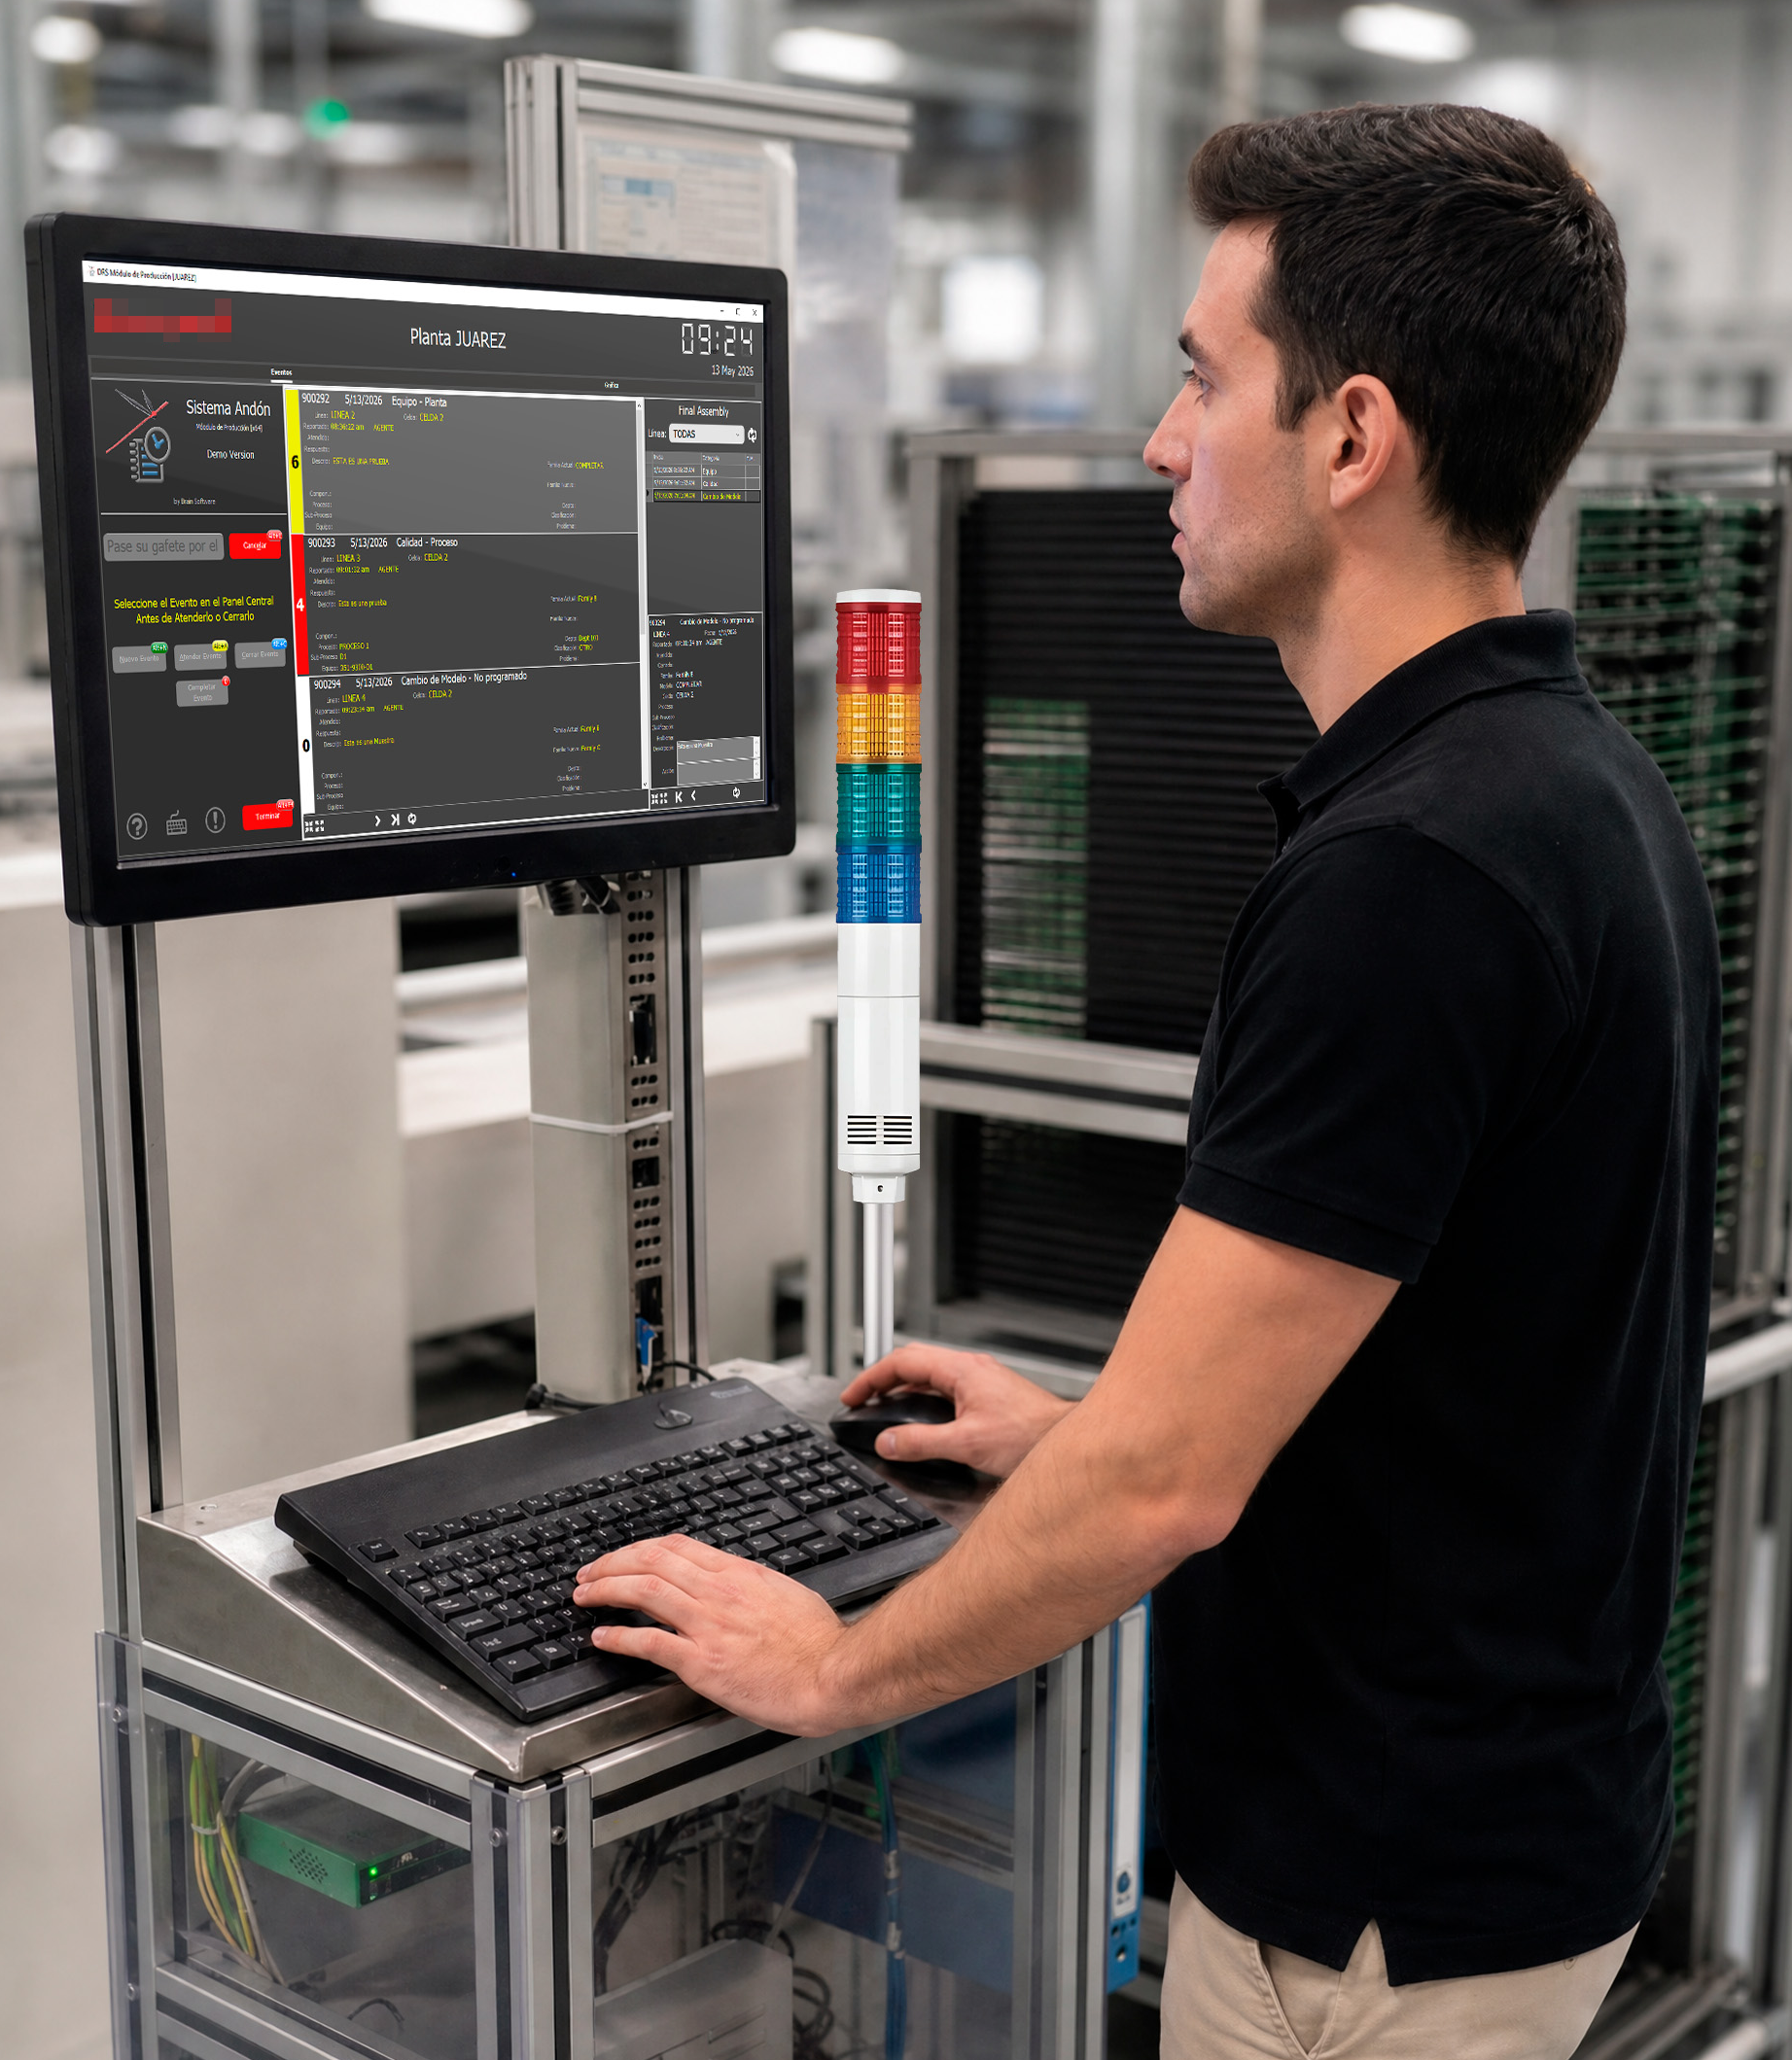
To record an incident, operators initiate an event and select details from a preconfigured, multi-level hierarchy of classifications. A visual signal can be displayed to draw attention to the event.
While the event is active, it can escalate through five levels, sending emails to those responsible for fixing the cause. Additionally, text messages are sent to those unable to access email.
Once the event is attended, resolved and closed, the software registers the response and resolution times, storing them in a database for further analysis. This makes it easy to generate metrics for Mean Time to Repair (MTTR) and response efficiency..
Downtime events are ultimately classified into incidents like:
- Breakdowns and equipment failures,
- Technical reasons related to equipment and process,
- Quality-related events - such as when a line fails to meet production standards
- Operational issues - when the procedures are not followed correctly,
- Unplanned stops - including material or labor shortages,
- Planned stops - such as maintenance, changeovers, and setups
- Custom categories -configure any category/subcategory combination to register any event according to your needs, even those that do no generate downtime.
Events are typically segmented by Plant, Area, Line, Equipment, Cell, and Process to ensure downtime is precisely assigned. Furthermore, you can assign cost centers—such as Department, Sub-department, or specific Cost Codes—to accurately allocate the downtime hours
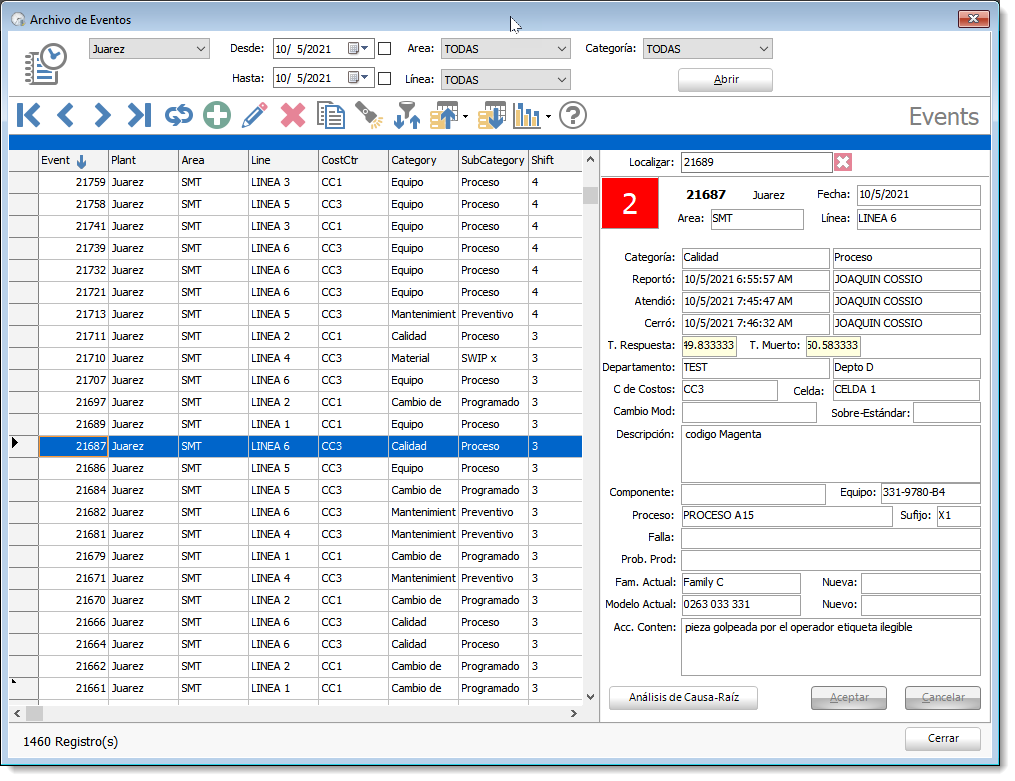
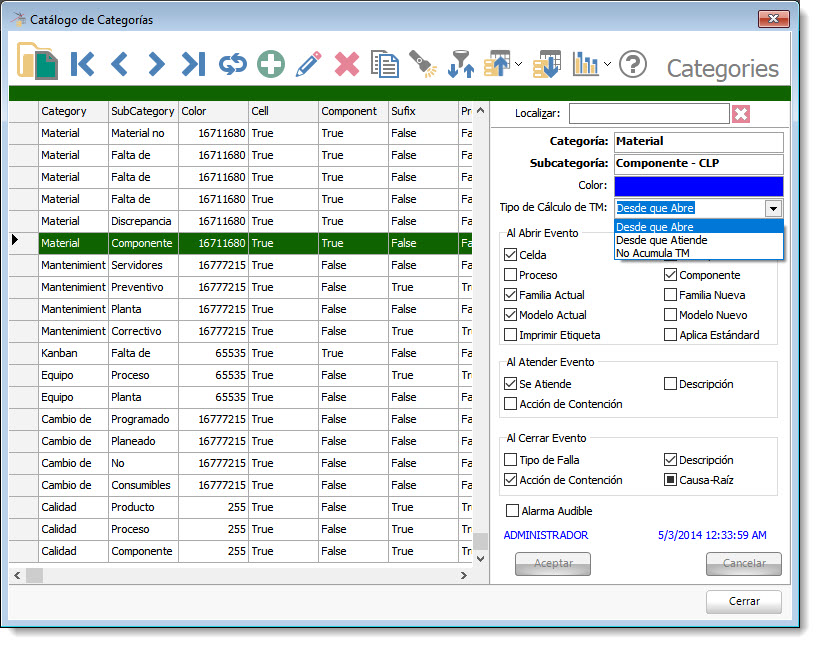
All incidents are grouped into categories and sub-categories.
Events are typically segmented by Plant, Area, Line, Equipment, Cell, and Process to ensure downtime is precisely assigned. Furthermore, you can assign cost centers—such as Department, Sub-department, or specific Cost Codes—to accurately allocate the downtime hours.
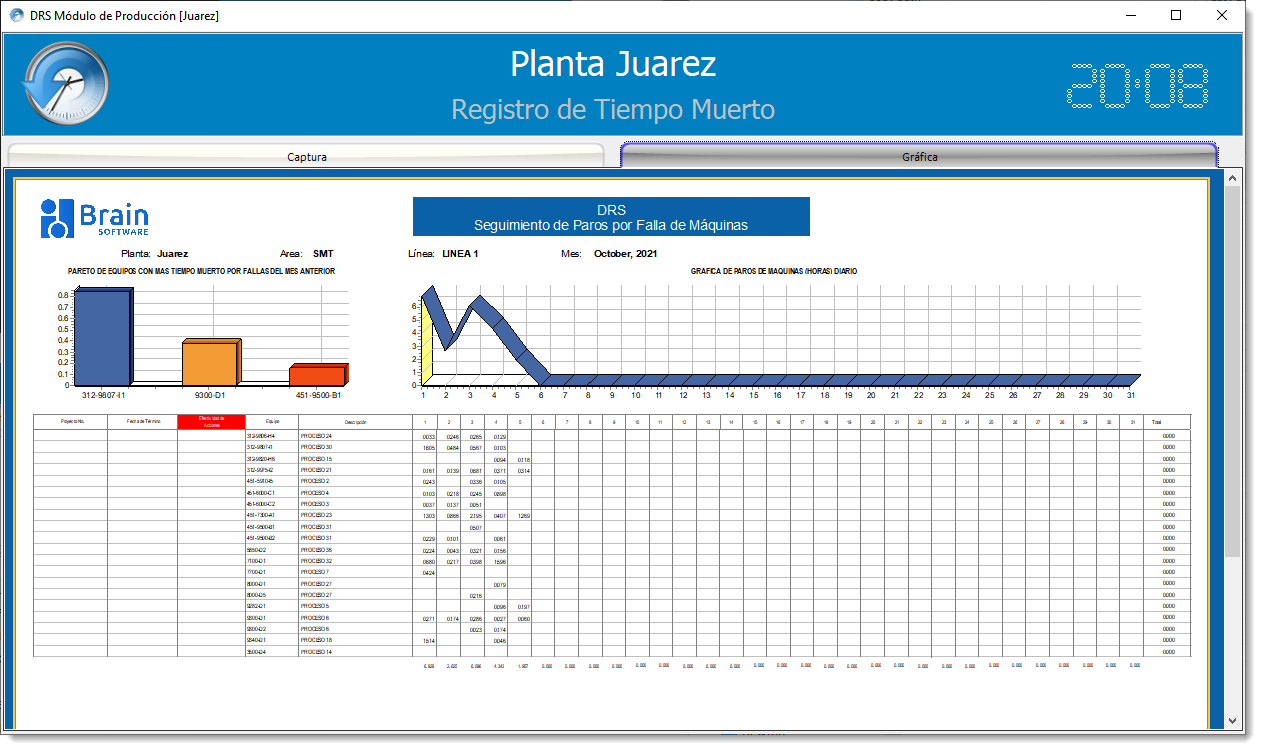
Use KPIs to understand, analyze and reduce the downtime.
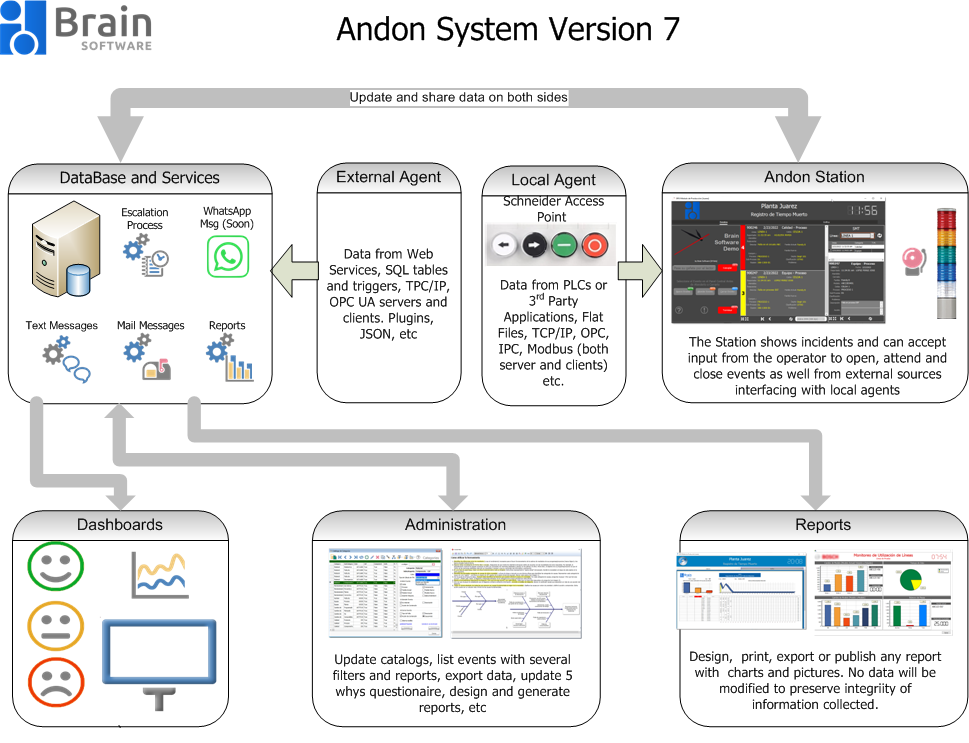
Architecture
Benefits
Implementing Brain Andon System provides both immediate operational improvements and long-term cultural shifts centered around efficiency and quality.
- Reduced Downtime: By providing instantaneous notification of issues (dropping notification time from minutes to seconds), Andon systems significantly slash the lag between problem detection and resolution. Some implementations report unplanned downtime reductions of 20–30%
- Improved Product Quality: Operators are empowered (and often obligated) to stop the line upon detecting a defect. This prevents faulty parts from proceeding down the assembly line, which reduces scrap, rework costs, and the risk of defective products reaching customers
- Enhanced Productivity (OEE): By identifying bottlenecks and resolving issues on demand, factories often see a 10–20% boost in Overall Equipment Effectiveness (OEE).
- Cost Savings: Timely detection at the source eliminates the need for expensive "catch-up" repairs or fulfilling orders with flawed items, ultimately protecting the company’s bottom line.
- Respond faster - with immediate availability of downtime information - even in very large industrial environments.
- Improved accuracy of downtime events - occurrences, duration, reasons; build a solid platform for decision making.
- History - develop a detailed history of downtime events for Continuous Improvement Teams to work with.
- Visibility - Events are displayed in station with an escalation level to show its duration.
- Save time - With computerized data collection - reducing non-productive wasted time.
- Reduce conflict – all departments will share the same version of downtime records and same information on real time.
- Fast communication - Send e-mails and SMS to every one that must know.
- Reports and charts - DTRS software data can be used to calculate relevant KPIs like MTBF, MTTR or MTTF
- Wide visibility -downtime events can be displayed on dashboards and be exported to Excel to perform additional analysis.
- High integration with other applications - by means of an agent, Brain Andon can process data from PLCs, wireless access points, test stations, etc.
Modules
|
|
Administration Module This module contains all catalogs and tools to administer Brain's Andon System. You will preview, print. export and design reports and graphs. |
|
|
Production Module This module registers the downtime events for one or several lines. Also shows the lights for the active events, the scalation level and lets users to create, attend and close events. |
|
|
Dashboard Module Use this module to display and monitor the events of a set of lines, configurable in the Administration Module.. |
|
|
Reporter Module In this module, you can filter the events by date, production area, event categories and any other criterion you choose, design, display and print or export charts and reports. |
|
|
Especial Module This module is similar to the Dashboard Module, execept it shows events for lines and categories. You configure it in the Administracion Module. New in version 6. |


Windows Services
|
|
Event Escalation Service This windows service escalate events according to 5 preconfigured levels to report them to involved individuals. Level 1 could be technicians and level 5 plant manager This service also prepares the text messages and emails to be send. |
|
|
Mail Service This service sends the email already prepared. |
|
|
Text Messages Service This service processes the text messages already prepared. A subscripton to Altiria message provider is required |



Enhancements in Version 7
Administration Module
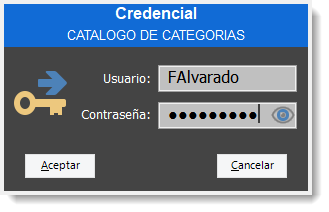
Log in once, No need to write you user name and password for each catalog you want to open.
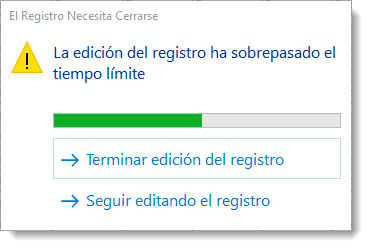
Safe editing mode:If you take a long time editing a record, the system advises you so, and if the station is unattended, ends the operation for you.
Updated reports in Reporter Module and in Administration Module. We included a Report Editor so you can modify the new reports
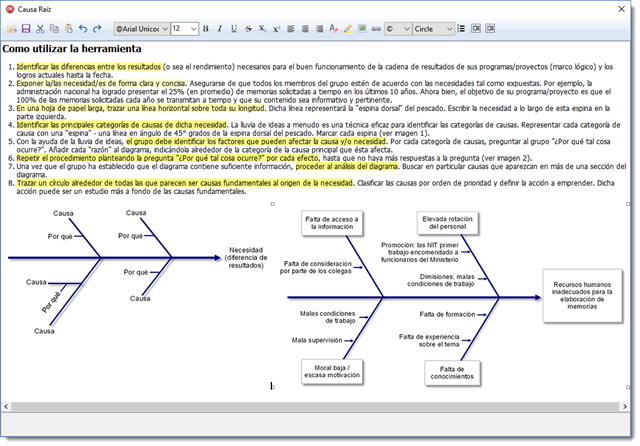
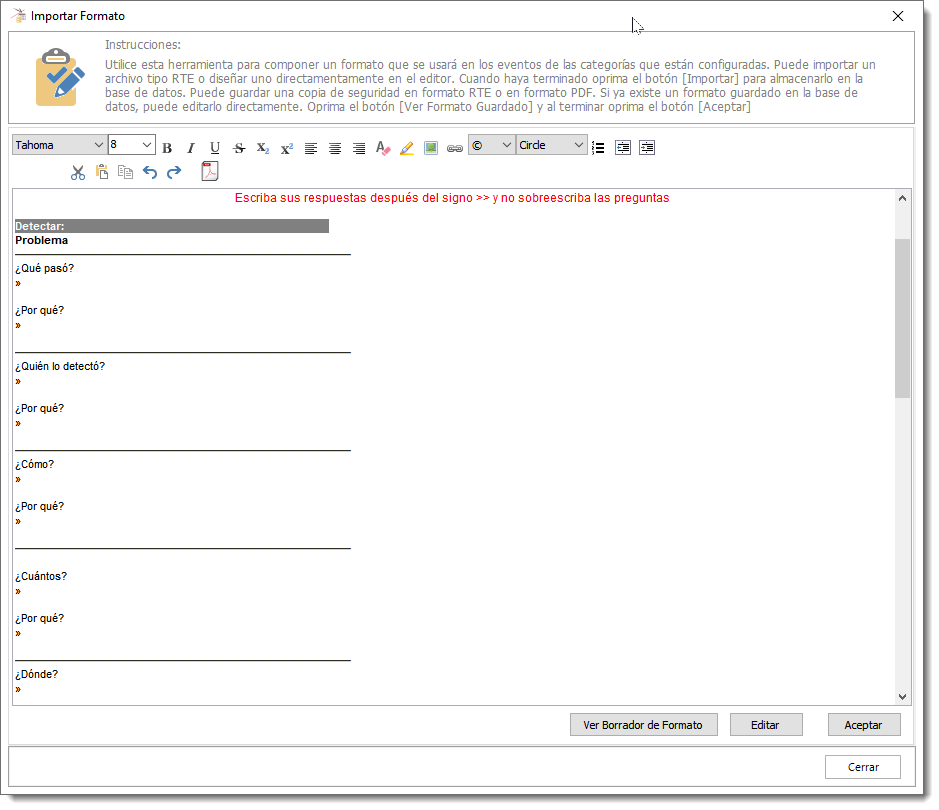
Root Cause Analysis: We have added a new module to facilitate Root Cause Analysis (RCA) using the 'Five Whys' method to identify factors behind closed events. To prevent delays in the closing process, the template is completed after the event is closed and remains available for review in the Administration Module. The system supports all standard file formats (DOC, DOCX, XLS, XLSX, etc.) and includes a full-featured rich text editor for highlighting text and inserting images.
|
|
|
Production Module
Several sources for open, attend and close events will be added, including text files generated by external applications.
TCP connection with Schneider's Access Point and wireless buttons and from any other sources.
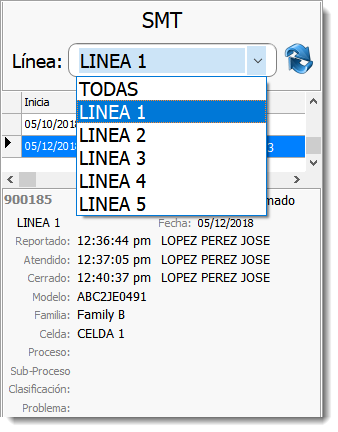
Multi Line GUI: You will configure the production module to register the downtime of any line in the same area or all lines together. Select one line name or "TODAS" and the events for the shift will be displayed. This is useful when you setup a new line and need to start registering the downtime right away.